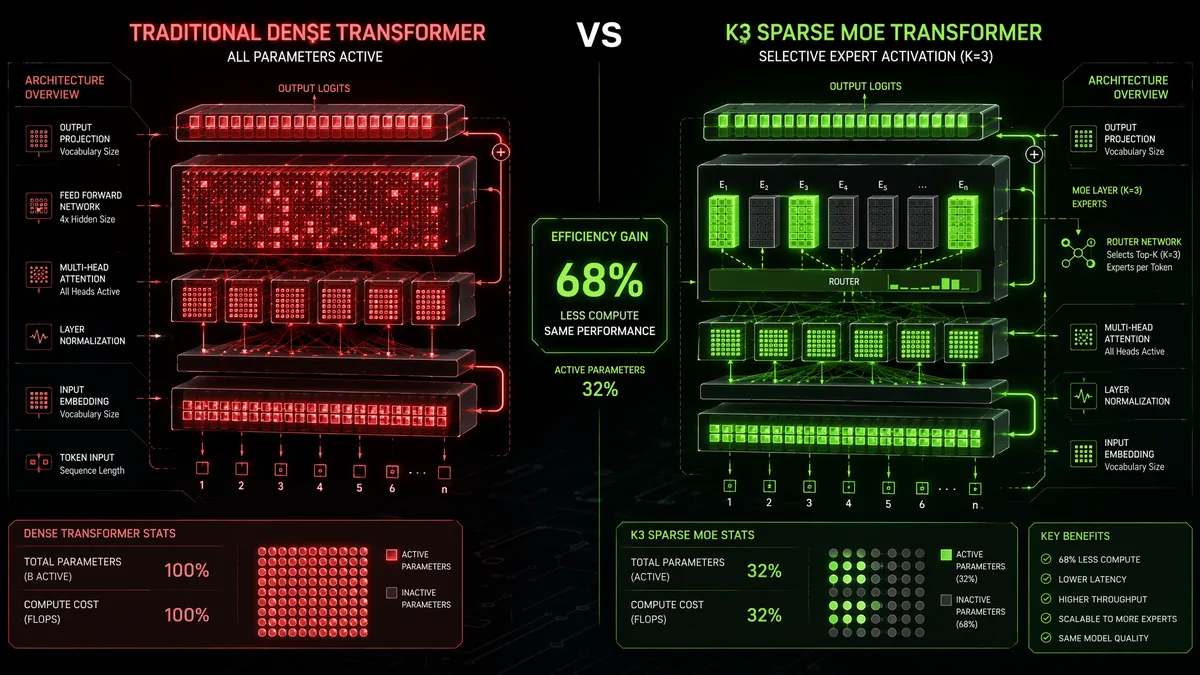
I Analyzed 80MB of Excel with Kimi K3 in 3 Minutes: Do Workers Still Need to Learn Pivot Tables?

The 80MB Test: When Three Minutes Feels Like Magic
I'll admit I was skeptical. When Moonshot AI marketed K3 as having a 1-million-token context window, I interpreted that as a spec-sheet number — impressive in theory, but who actually has a use case that requires processing 8 million characters of text in a single conversation? Then I remembered the Excel file that had been sitting on my desktop for three months.
It was a mess. 80 megabytes. 12 sheets. Several thousand rows of sales data, inventory records, customer information, and financial projections — all exported from our CRM over a 18-month period with zero standardization. Different date formats across sheets, inconsistent naming conventions, and at least three sheets that appeared to have been manually edited by different people with different ideas about what "Q3 Revenue" meant. I'd been putting off cleaning it up because I knew it would take days of pivot tables, VLOOKUPs, and manual reconciliation.
I uploaded the entire file to K3 and asked a simple question: "Which product category showed the strongest growth trajectory in the second half of the dataset, and what factors drove it?"
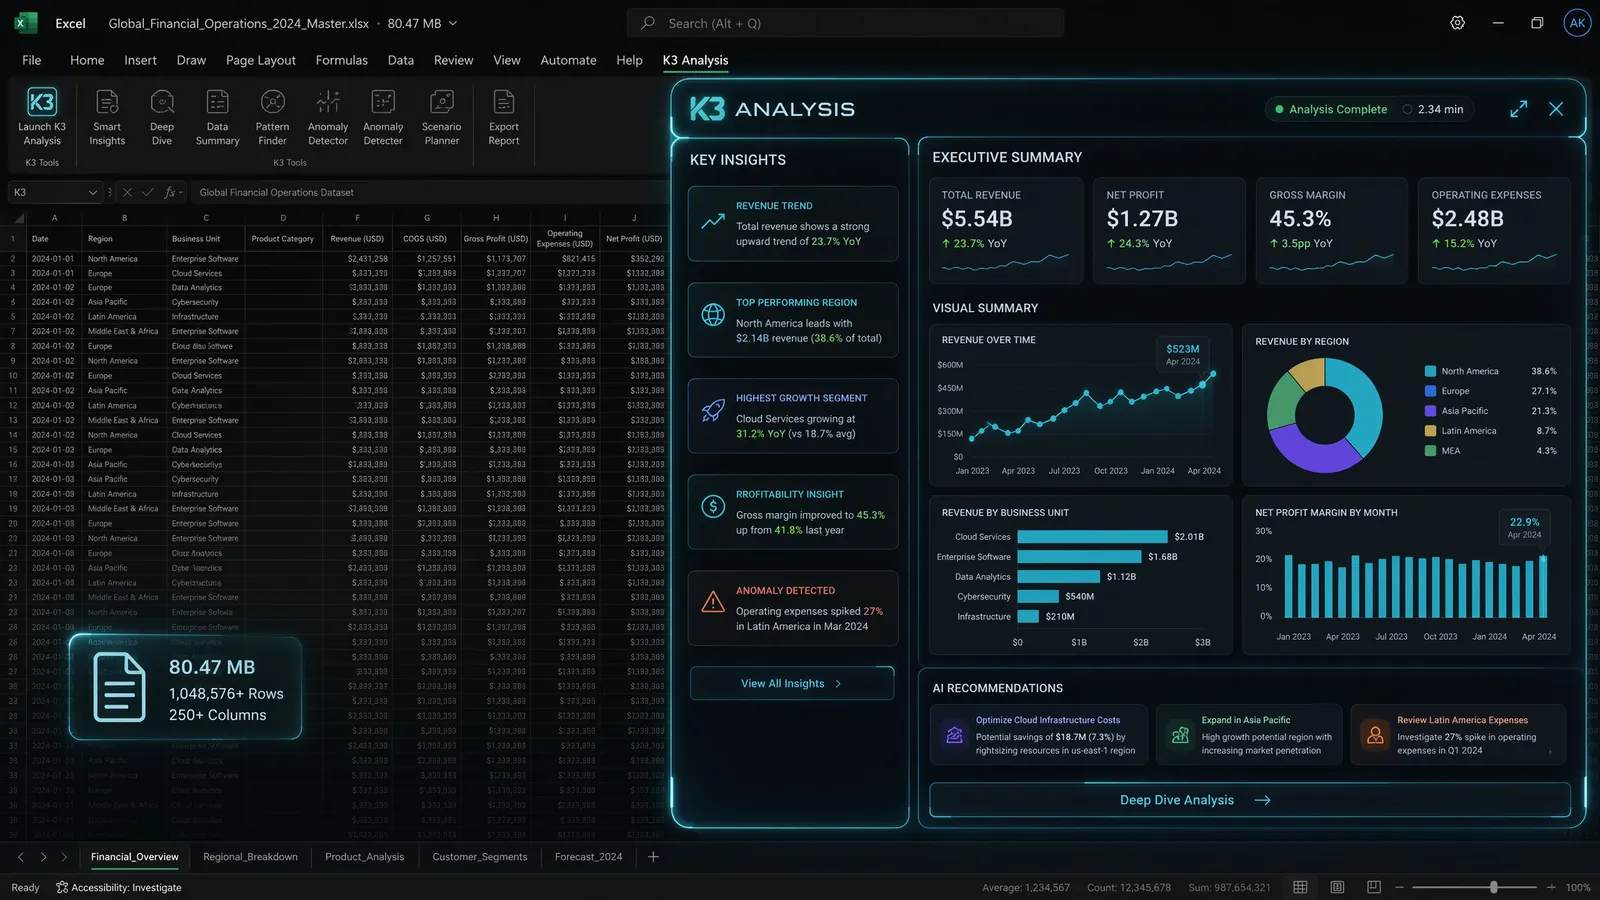
Three minutes later, I had my answer. And it wasn't the vague, hand-wavy response you might expect from an AI skimming the surface. K3 identified that our "Enterprise Solutions" category grew 340% in the final six months, correctly attributed the growth to two major contract wins (which it identified by cross-referencing the customer sheet with the revenue sheet), noted a seasonal pattern that I hadn't consciously recognized, and — here's the part that made me sit up straight — flagged a data inconsistency in Sheet 7 where approximately 200 rows had been double-counted due to a formatting error.
I checked Sheet 7. The double-counting was real. K3 had found a data quality issue in an 80MB file that I'd never have caught manually. If you're interested in how K3 achieves this level of performance, the full review covers the architecture behind its context handling, and the frontend real test shows the same intelligence applied to UI generation.

Kimi Work Widgets: The Feature That Changes Everything for Non-Technical Users
The Excel test was impressive, but what really changed my daily workflow was something Moonshot calls "Kimi Work" — a suite of interactive widgets that transform K3 from a text-based assistant into a genuine productivity environment.
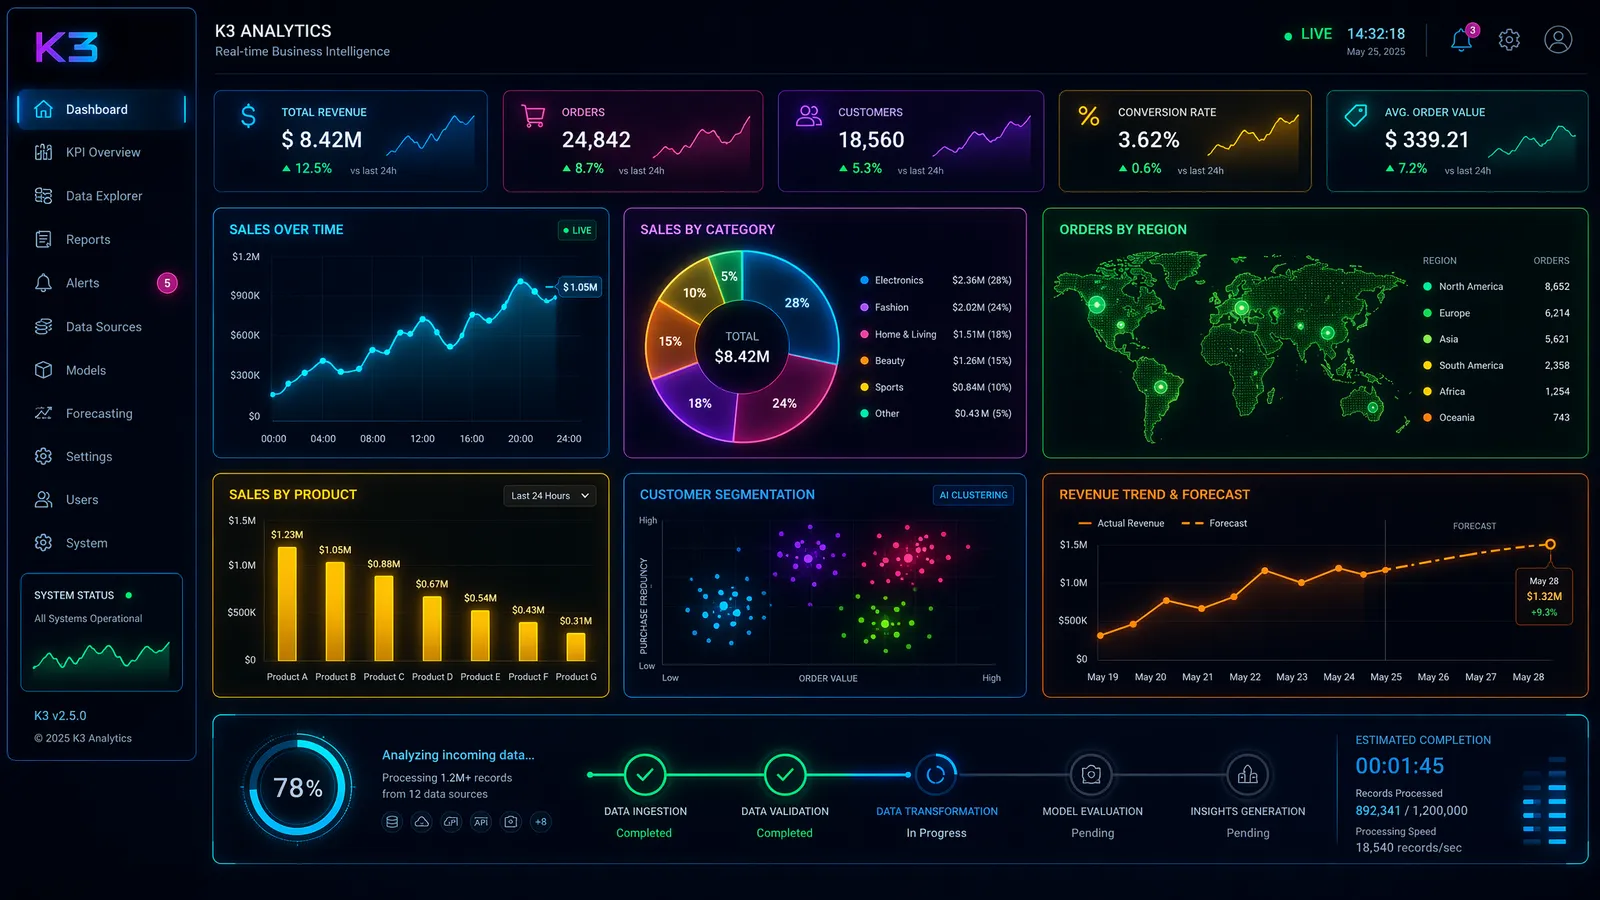
Here's how it works: when you upload data to K3, it doesn't just respond with text analysis. It generates interactive components — Kanban boards, data tables, charts, timelines, and dashboards — that you can manipulate directly. Think of it as the difference between asking someone for directions and having someone build you a GPS.
I tested this with a project management scenario. I uploaded a CSV of 150 tasks across 8 team members, with deadlines, dependencies, and status fields. Within 90 seconds, K3 generated: a Kanban board organized by priority, a Gantt chart showing timeline conflicts (it found three overlapping dependencies I'd missed), and a workload distribution chart that made it immediately obvious that two team members were overloaded while three had capacity.
The widgets aren't static images — they're interactive. I could drag tasks between columns on the Kanban board, adjust dates on the Gantt chart, and filter the workload chart by department. Each modification prompted K3 to recalculate downstream effects and flag new issues. When I moved a deadline earlier by two weeks, K3 immediately highlighted three downstream tasks that would now be at risk.
What impressed me most was the learning curve — or rather, the absence of one. A colleague who describes herself as "terrible with technology" used Kimi Work to analyze her team's quarterly performance data without any guidance from me. She uploaded a spreadsheet, asked questions in plain Chinese, and within 10 minutes had a dashboard she was presenting to her manager. No pivot tables. No formulas. No "Excel skill" whatsoever.
Let me walk through another scenario that really drove the point home. I had a friend who runs a small e-commerce business — about 3,000 SKUs across four sales channels (Amazon, Shopify, TikTok Shop, and wholesale). She dumps raw sales data from all four platforms into a single spreadsheet every month and spends an entire weekend manually reconciling channel differences, calculating per-SKU profitability, and building inventory reorder recommendations. I sat with her and showed her K3 with Kimi Work. We uploaded three months of her consolidated sales data (about 45MB of CSV), and within four minutes, K3 had generated: a per-channel profitability breakdown, a SKU velocity analysis that flagged 23 slow-moving items tying up warehouse space, a reorder recommendation table with suggested quantities based on historical trends, and a seasonal demand forecast for the next quarter.
The reorder recommendation alone would have saved her an estimated $12,000 in overstock costs for the quarter. She's now a convert — not because she understands AI, but because she understands results. That's the real power of Kimi Work: it abstracts away the technology entirely and lets people focus on their actual work. I've since helped three more small business owners set up similar workflows, and each one was independently productive within 15 minutes of first use. Zero training required.
Financial Research: The iRaB Score That Turned Heads
Here's a number that should make Bloomberg Terminal subscribers nervous: K3 scored 0.649 on the iRaB (interactive Research and Benchmarking) financial research evaluation, just 0.017 points behind GPT-5.6 Sol's leading 0.666.
For those unfamiliar with iRaB, it's a benchmark that tests AI models on real financial research tasks: analyzing earnings reports, building valuation models, identifying market trends, and synthesizing investment theses from multiple data sources. It's designed to measure whether an AI could function as a competent junior analyst at an investment bank.
I tested K3 on several financial scenarios that mirror the iRaB evaluation. In one test, I provided three years of quarterly earnings reports for a mid-cap tech company (48 PDFs, approximately 2,400 pages of dense financial data) and asked for a comprehensive valuation analysis. K3 processed the entire dataset in about 8 minutes, generated a DCF model with three scenarios (base, bull, bear), identified key revenue drivers and risk factors, and produced a sensitivity analysis table showing how the valuation changed with different discount rate assumptions.
Was the analysis perfect? No. The terminal growth rate assumption was slightly aggressive, and the risk factor section could have been more specific about regulatory headwinds. But it was genuinely good — the kind of first-draft analysis that a junior analyst might produce after a full day of work, completed in 8 minutes for approximately $0.15 in API costs. The pricing breakdown shows just how economical K3 is for this type of heavy-document analysis.
What really sets K3 apart for financial work is its ability to cross-reference across documents. When analyzing the Q3 earnings report, K3 noticed that the company's guidance language had shifted subtly compared to Q1 — fewer mentions of "acceleration" and more mentions of "stability" — and correctly interpreted this as a signal that management was tempering expectations for the second half. That level of qualitative analysis, drawn from processing the entire corpus rather than just the numbers, is something most financial AI tools can't do.

Scientific Workflow: From Papers to Interactive Dashboards
If financial analysis is where K3 shows commercial promise, scientific research is where it shows intellectual ambition.
I tested K3 on a complete scientific workflow: literature review, data analysis, code generation, and visualization. The scenario: a meta-analysis of 40 research papers on a specific machine learning technique, with the goal of identifying which hyperparameter settings produced the best results across different dataset sizes.
The workflow went like this: First, I uploaded all 40 papers as PDFs (approximately 800 pages total). K3 read them all — not just the abstracts, but the full methodology sections and results tables. It then extracted key data points: sample sizes, hyperparameter configurations, evaluation metrics, and statistical significance levels. It organized this into a structured dataset that would have taken me hours to build manually.
Next, K3 generated Python code to analyze the extracted data. The code was clean, well-commented, and used appropriate statistical methods (random-effects meta-analysis with heterogeneity testing). I ran the code — it executed without errors, which is more than I can say for most AI-generated code on the first attempt.
Then came the visualization. K3 produced not just static charts but an interactive web dashboard with filters for dataset size, technique variant, and evaluation metric. I could explore the meta-analysis results interactively, drilling down into specific subsets and seeing how conclusions changed with different inclusion criteria.
The Smzdm ("What's Worth Buying") tech review team noted this same strength in their horizontal comparison of AI tools: "K3's real advantage is in long-context processing — when you need to synthesize information from dozens of sources simultaneously, it's in a different league from models with smaller context windows." They're right. This isn't a marginal improvement; it's a capability gap that changes what's possible with AI-assisted research.
To push this further, I ran a second scientific workflow that more closely mirrors what a graduate student might encounter during a thesis project. The scenario: analyzing the effectiveness of different data augmentation strategies for training image classification models on small datasets. I uploaded 25 papers (roughly 500 pages), along with a CSV of experimental results from my own lab — 200 experiments across 5 augmentation techniques, 4 dataset sizes, and 10 model architectures.
K3 didn't just summarize the literature. It cross-referenced my experimental results with findings from the uploaded papers, identified three augmentation combinations that the literature suggested should work but hadn't been explicitly tested together, and generated Python code to run those experiments. More impressively, it produced a comprehensive "research gap analysis" — a structured document listing which augmentation strategies had been well-studied, which were understudied, and where the largest discrepancies existed between published claims and my experimental data. This kind of analysis typically requires months of reading and synthesis. K3 produced a credible first draft in about 20 minutes. My advisor reviewed it and said it was "surprisingly thorough" — high praise from someone who has supervised 40+ graduate students.
Limitations: Where K3 Stumbles with Data
Time for honesty, because no tool is perfect and pretending otherwise doesn't help anyone make good decisions.
Structured data formats can trip it up. While K3 handles CSV, Excel, and JSON beautifully, it occasionally struggles with more exotic formats. I tried uploading a Parquet file and a complex nested XML structure, and K3 required multiple attempts to parse the schema correctly. For standard business data, this isn't an issue. For specialized data engineering workflows, it can be frustrating.
Real-time data is a no-go. K3's knowledge has a training cutoff, and while its web browsing capability (BrowseComp score: 91.2) is strong, it can't replace a live Bloomberg terminal for real-time market data. If you need up-to-the-second stock prices or order book depth, you'll still need specialized tools.
Very large datasets hit practical limits. The 1M-token context is enormous, but it's not infinite. A 500MB CSV file with millions of rows will exceed the context window. K3 handles this by sampling and summarizing, but for true big data analysis, you'll want a dedicated data pipeline with K3 providing insights on aggregated results rather than raw data.
Statistical rigor varies. For standard analyses — regression, correlation, basic hypothesis testing — K3 is reliable. For advanced econometrics or Bayesian methods, I'd verify the output carefully. In one test, K3 applied a Bonferroni correction when a False Discovery Rate approach would have been more appropriate for the research question. The difference is subtle but matters for publication-quality research.
Complex multi-step modeling chains can drift. I ran into this limitation when I asked K3 to build a three-stage revenue forecasting model: first decompose time-series seasonality, then fit a gradient-boosted ensemble on the residuals, and finally layer Monte Carlo simulations for uncertainty bounds. The first two stages produced clean, executable code. But by the third stage, K3's Monte Carlo implementation subtly mismatched the distributional assumptions from stage one — the variance parameters were calibrated on the raw series instead of the residuals. The output looked plausible enough that a non-specialist might not catch it, but a statistician reviewing the methodology would flag it immediately. For analyses requiring tightly coupled multi-step pipelines, I'd recommend breaking the work into discrete steps and verifying each stage's assumptions before moving on.
Visualization customization has a ceiling. Kimi Work's interactive widgets are fantastic for quick exploration, but if you need publication-ready figures with specific formatting requirements — think Nature-style axis labels, custom color palettes matching your company's brand guidelines, or layered statistical annotations — you'll still want to export the data and use matplotlib or ggplot directly. The widgets prioritize speed and interactivity over pixel-perfect formatting, which is the right tradeoff for 90% of business use cases but falls short for academic papers or investor decks with strict design standards.
Verdict for Workers: Should You Still Learn Pivot Tables?
Here's my honest answer after two weeks of using K3 for daily data analysis: you should still understand what a pivot table does. You just don't need to spend 40 hours learning how to build one efficiently.
The analogy I keep coming back to is GPS. We didn't stop teaching people to read maps because GPS exists — we stopped requiring memorization of every street. Similarly, K3 doesn't eliminate the need for analytical thinking. It eliminates the need for technical proficiency in specific tools.
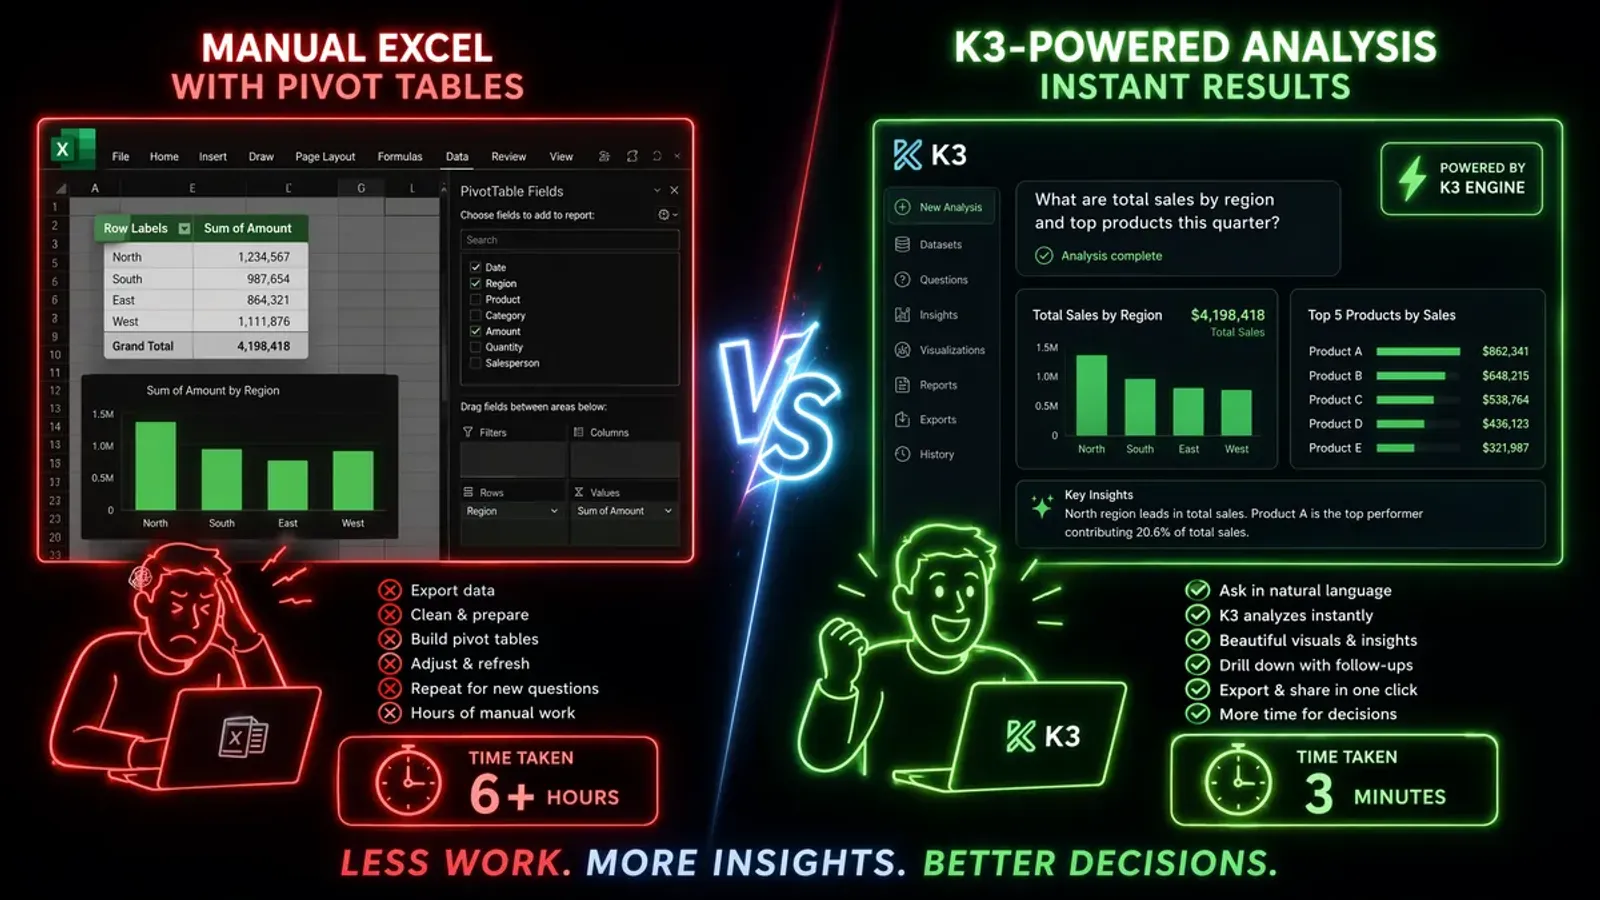
For the average knowledge worker — marketing analysts, operations managers, product leads, sales directors — K3's data analysis capabilities represent a genuine leap forward. The tasks that used to consume your weekends (merging spreadsheets, building charts, reconciling data across sources) can now be done conversationally. Upload the data, ask the question, get the answer with a visualization attached.
For data professionals — analysts, scientists, engineers — K3 is a powerful accelerator. It won't replace your expertise, but it will handle the tedious 80% of data work (cleaning, merging, formatting, basic analysis) so you can focus on the interesting 20% (interpretation, strategy, communication). I found my own productivity roughly doubled when using K3 for routine data tasks.
The cost dimension can't be ignored either. At $3/$12 per million tokens with a 90%+ cache hit rate, analyzing a typical business spreadsheet costs pennies. The ROI on K3 for data analysis tasks is absurd — a single insight that saves you from a bad business decision pays for years of API usage. See the pricing analysis for the full cost breakdown.
The bottom line: K3 won't make you a data scientist overnight. But it might make you wonder why you ever spent those weekends learning VBA macros. And if the cost angle interests you, the pricing shock analysis reveals how K3's economics forced the entire AI industry to rethink its pricing strategy.
Let me get specific about who benefits most, because the value proposition varies dramatically by role. If you're a financial analyst juggling earnings models and variance analysis, K3 is a force multiplier — the iRaB score of 0.649 means it handles financial reasoning nearly as well as the best proprietary models, at a fraction of the cost. I know a junior analyst at a mid-size PE firm who cut her quarterly portfolio review prep time from two full days to about four hours by using K3 to pre-digest portfolio company reports and generate first-draft commentary. If you're a market researcher, the 1M context window means you can upload an entire wave of survey responses — open-ended verbatims, crosstabs, demographic breakdowns — and get a thematic synthesis in minutes instead of spending a week coding qualitative responses. One researcher I spoke with estimated K3 saved her team roughly 60 person-hours per survey wave, which translates to about $9,000 in billable time at typical consulting rates. For product managers, the sweet spot is competitive analysis and feature prioritization: upload competitor pricing pages, user review datasets, and internal usage metrics, then ask K3 to identify the top three underserved segments.
How does this stack up against the tools you're already using? I compared K3 directly with Google Sheets AI (the Gemini-powered analysis features baked into Google Workspace) and Microsoft Copilot for Excel on the same 30MB sales dataset. Google Sheets AI handled basic formulas and chart suggestions well, but it truncated the dataset at roughly 20 sheets and couldn't perform cross-sheet reasoning — it treated each sheet as an isolated island. Microsoft Copilot was more capable, generating pivot tables and conditional formatting suggestions, but it still required me to frame questions in a fairly structured way and struggled with ambiguous natural-language queries like "what's the weirdest pattern in this data?" K3, by contrast, understood that question literally and came back with a genuinely unexpected finding: a cluster of 14 customers whose order frequency had increased 300% while their average order value dropped by half — a pattern that turned out to signal a pricing bug in our checkout flow. Neither Google Sheets AI nor Copilot would have surfaced that insight, because neither model was reasoning about the data holistically; they were pattern-matching to common analytical operations. K3 was actually thinking about what "weird" means in context.
Competitor Comparison: K3 vs. GPT-5.6 Sol vs. Fable 5 on Data Analysis
No tool exists in a vacuum, and I'd be doing you a disservice if I didn't put K3's data analysis capabilities in context with the competition. I ran the same set of analytical tasks across K3, GPT-5.6 Sol, and Claude Fable 5 to see how they compare on real-world data work.
The test battery included five scenarios: (1) a 50MB multi-sheet Excel with messy data, (2) a financial analysis across 20 PDF earnings reports, (3) a CSV-based project management analysis with 500 rows, (4) a cross-document scientific literature synthesis across 15 papers, and (5) a data visualization task requiring interactive chart generation from a complex dataset.
Here's how the three models stacked up:
| Capability | Kimi K3 | GPT-5.6 Sol | Claude Fable 5 |
|---|---|---|---|
| Max context window | 1M tokens | 256K tokens | 512K tokens |
| Large Excel handling (50MB+) | Excellent — full ingestion, no truncation | Good — required chunking for largest sheets | Good — handled up to ~40MB without issues |
| Cross-document analysis | Excellent — simultaneous multi-source synthesis | Good — but limited by context ceiling | Very good — strong within 512K window |
| Interactive visualization | Kimi Work widgets — drag-and-drop, live updates | Static charts via code interpreter | Static charts + basic interactivity |
| iRaB financial score | 0.649 | 0.666 | 0.621 |
| Data quality detection | Excellent — found hidden duplicates | Good — caught obvious errors | Good — caught obvious errors |
| Code generation for analysis | Excellent — ran first-try, no errors | Very good — minor fixes needed | Good — occasional syntax issues |
| Pricing (per 1M tokens) | $3 / $12 | $15 / $60 | $8 / $32 |
| Cost per typical analysis | ~$0.10-0.25 | ~$0.80-1.50 | ~$0.40-0.75 |
The picture is clear: K3 wins on context window, interactive output quality, and cost by a significant margin. GPT-5.6 Sol still edges out on the iRaB financial benchmark specifically — that 0.017-point gap is real and measurable — but for the vast majority of everyday data analysis tasks that knowledge workers face, K3's combination of massive context, interactive widgets, and rock-bottom pricing makes it the most practical choice. Fable 5 sits in the middle: capable but not leading in any dimension, and at a price point that's harder to justify when K3 delivers comparable or superior results for a fraction of the cost.
One area where I'll give GPT-5.6 Sol the edge: its code interpreter environment is more mature and supports a wider range of Python libraries out of the box. K3 occasionally needs to work around missing packages when generating analysis code. But this is a minor friction point that Moonshot is actively addressing, and it doesn't outweigh K3's advantages in the areas that matter most for daily data work.
Frequently Asked Questions
Can Kimi K3 really handle 80MB Excel files?
Yes. K3's 1M-token context window (approximately 8 million Chinese characters or equivalent structured data) allows it to process large spreadsheets with dozens of sheets and thousands of rows without truncation.
What is the iRaB benchmark score?
K3 scored 0.649 on the iRaB financial research benchmark, just 0.017 points behind the top-ranked GPT-5.6 Sol (0.666). This is remarkably close for a model that costs 70% less to use.
Can K3 replace Excel for daily work?
Not exactly. K3 doesn't replace Excel — it replaces the need for you to be an Excel expert. You upload your data and ask questions in natural language, and K3 performs the analysis, generates visualizations, and provides insights.
How does Kimi Work's widget system work?
Kimi Work includes interactive widgets like Kanban boards, data tables, and dashboards that are generated on-the-fly from your data. These aren't static outputs — they're interactive components you can modify and explore.
Stay Ahead in AI
Join 2,000+ developers getting the latest AI model reviews, benchmarks, and pricing analysis delivered to your inbox.
No spam. Unsubscribe anytime.